After the half-yearlies: read the results by question, not by student
A section average tells you almost nothing about what to teach next. Read the same marks three ways, by cohort, by question and by prerequisite, and a class of "weak students" often turns out to be one missing skill from two years back.
Half-yearly marks are in the register by now, and most schools will read them the same way: a section average, a pass percentage, a list of students below 33%. That reading answers one question, who did badly. It does not say what to teach differently between now and the pre-board, which is the question that still has time to change a result.
The method below reads the same marks three ways. To show it working, I have used an invented Class 10 section: 40 students, one 80-mark Mathematics half-yearly paper, eight questions tracked one by one. No real school or student is behind any of these numbers.
57%
the invented section's average. On its own it looks like a class that is broadly fine.
73% vs 27%
what the same 35 students scored on routine questions against word problems.
5 of 40
students below 33%. They need a different response from everyone else.
Step 1: read the spread, not the average
The section averages 45.5 out of 80, 57%. The median is 47.5. Nothing about either number asks for action.
Now count students into bands:
- 60 to 80 marks: 4 students
- 40 to 59 marks: 28 students
- 27 to 39 marks: 3 students
- below 27, under 33%: 5 students
Two groups appear that the average blurred together. A large middle, 28 students packed between 40 and 59, and a separate tail of five students scoring between 11 and 21. Very few students sit between those groups. When the bands split like this, you are probably looking at two different problems, and the rest of the method is about telling them apart.
How do you analyse half-yearly results by question?
For each question, calculate two figures. Facility is the marks the whole class earned on that question divided by the marks available. Blank rate is the share of students who wrote nothing. This is step 2 of the method. If your teachers already record marks question by question, it is arithmetic on data you have. If they do not, start with the scripts of one section.
Here are the eight tracked questions in the invented paper:
- Q3, Real Numbers, HCF by prime factorisation (2 marks): 71% facility, 5% blank
- Q7, Polynomials, zeros and coefficients (3 marks): 66%, 0% blank
- Q12, Linear Equations, solve a given pair (3 marks): 70%, 2% blank
- Q18, Linear Equations, word problem on ages (4 marks): 26%, 48% blank
- Q21, Quadratic Equations, solve by formula (3 marks): 66%, 2% blank
- Q24, Quadratic Equations, word problem on area (5 marks): 24%, 30% blank
- Q27, Arithmetic Progressions, nth term (2 marks): 65%, 8% blank
- Q30, Arithmetic Progressions, word problem on savings (4 marks): 27%, 30% blank
Read down the list and the chapter stops mattering. Every routine question sits between 65% and 71%. Every word problem sits between 24% and 27%, and each has a blank rate of 30% or more. Nearly half the class left the ages problem empty.
A blank tells you something a wrong answer does not. A student who attempts and slips has a method that failed somewhere. A student who writes nothing usually could not find a way in at all. My working rule, not a standard: any question below half its marks with more than a fifth of the class blank goes on the list for step 4.
Step 3: separate the tail from the class
The five students below 33% need looking at separately, because they pull every figure down. Take them out and look at the other 35.
Those 35 students earned 73% of the marks on the routine questions and 27% on the word problems. They can solve a pair of linear equations. They can apply the quadratic formula. What they mostly cannot do is get from a paragraph to the equation.
The five in the tail look different. They scored 26% on routine questions and 14% on word problems. They are behind on almost everything, and a word-problem fix will not reach them. They need individual attention: what they missed, how long they have been behind, whether it is attendance, language or something else.
Schools often answer a low average with extra classes for "weak students". In this section, that response would aim remedial hours at five students while missing the problem shared by the other thirty-five.
Step 4: trace the failing skill back
The three word problems come from three different chapters and share one step: turning a sentence into an equation. "A father is three times as old as his son; in five years..." has to become two expressions in one unknown before any Class 10 method can start. That translation is taught when students first meet simple equations, around Class 7 and 8, and is assumed from then on.
Testing it takes ten minutes. Give the section five sentences to write as equations, with no solving required. For example: "A number increased by 7 is 19." "The length of a rectangle is 4 cm more than its width, and its perimeter is 36 cm." In the invented section, only 11 of the 40 students can do this reliably, which is the whole word-problem result in one number.
If your check comes out like that, more Class 10 word problems will not help, because students still cannot get into them. A few weeks of short, daily translation practice, from sentence to equation and nothing else, reaches the skill every one of those chapters depends on. Then re-test on fresh word problems before the pre-board.
The same reading works outside Mathematics. In Science, the question type to watch is usually the numerical, where a student has to pick the relation before any substitution can start. In Social Science it can be the source-based question. Whatever the subject, the test is the same: a question type that fails across chapters, with a high blank rate, while the routine questions in those chapters hold up.
The same question paper that shows you this also has to be built for it. If the half-yearly paper had no word problem, or put them all in one chapter, the pattern would never show. Our half-yearly blueprint post covers setting a paper where each question tests one identifiable thing.
What to do in the next two weeks
Get question-level marks for one subject and one class
Start with Class 10 Mathematics or Science. One section is enough to see whether the method is worth rolling out.
Band the totals before anyone discusses the average
If the bands split into a middle and a tail, the two groups need different plans.
Work out facility and blank rate for every question
Flag anything under half its marks with more than a fifth of the class blank.
Group the flagged questions by type, not chapter
Word problems, diagrams, reasoning, graphs. A type that fails across chapters is a skill.
Run a ten-minute prerequisite check
Test the underlying skill at the level it was first taught. If most of the section fails, change the teaching for everyone.
Plan the tail separately
Name the students under 33% and give each one a plan of their own.
When your school last analysed a half-yearly, did the plan that came out of it target a skill, or a list of students?
Take this with you
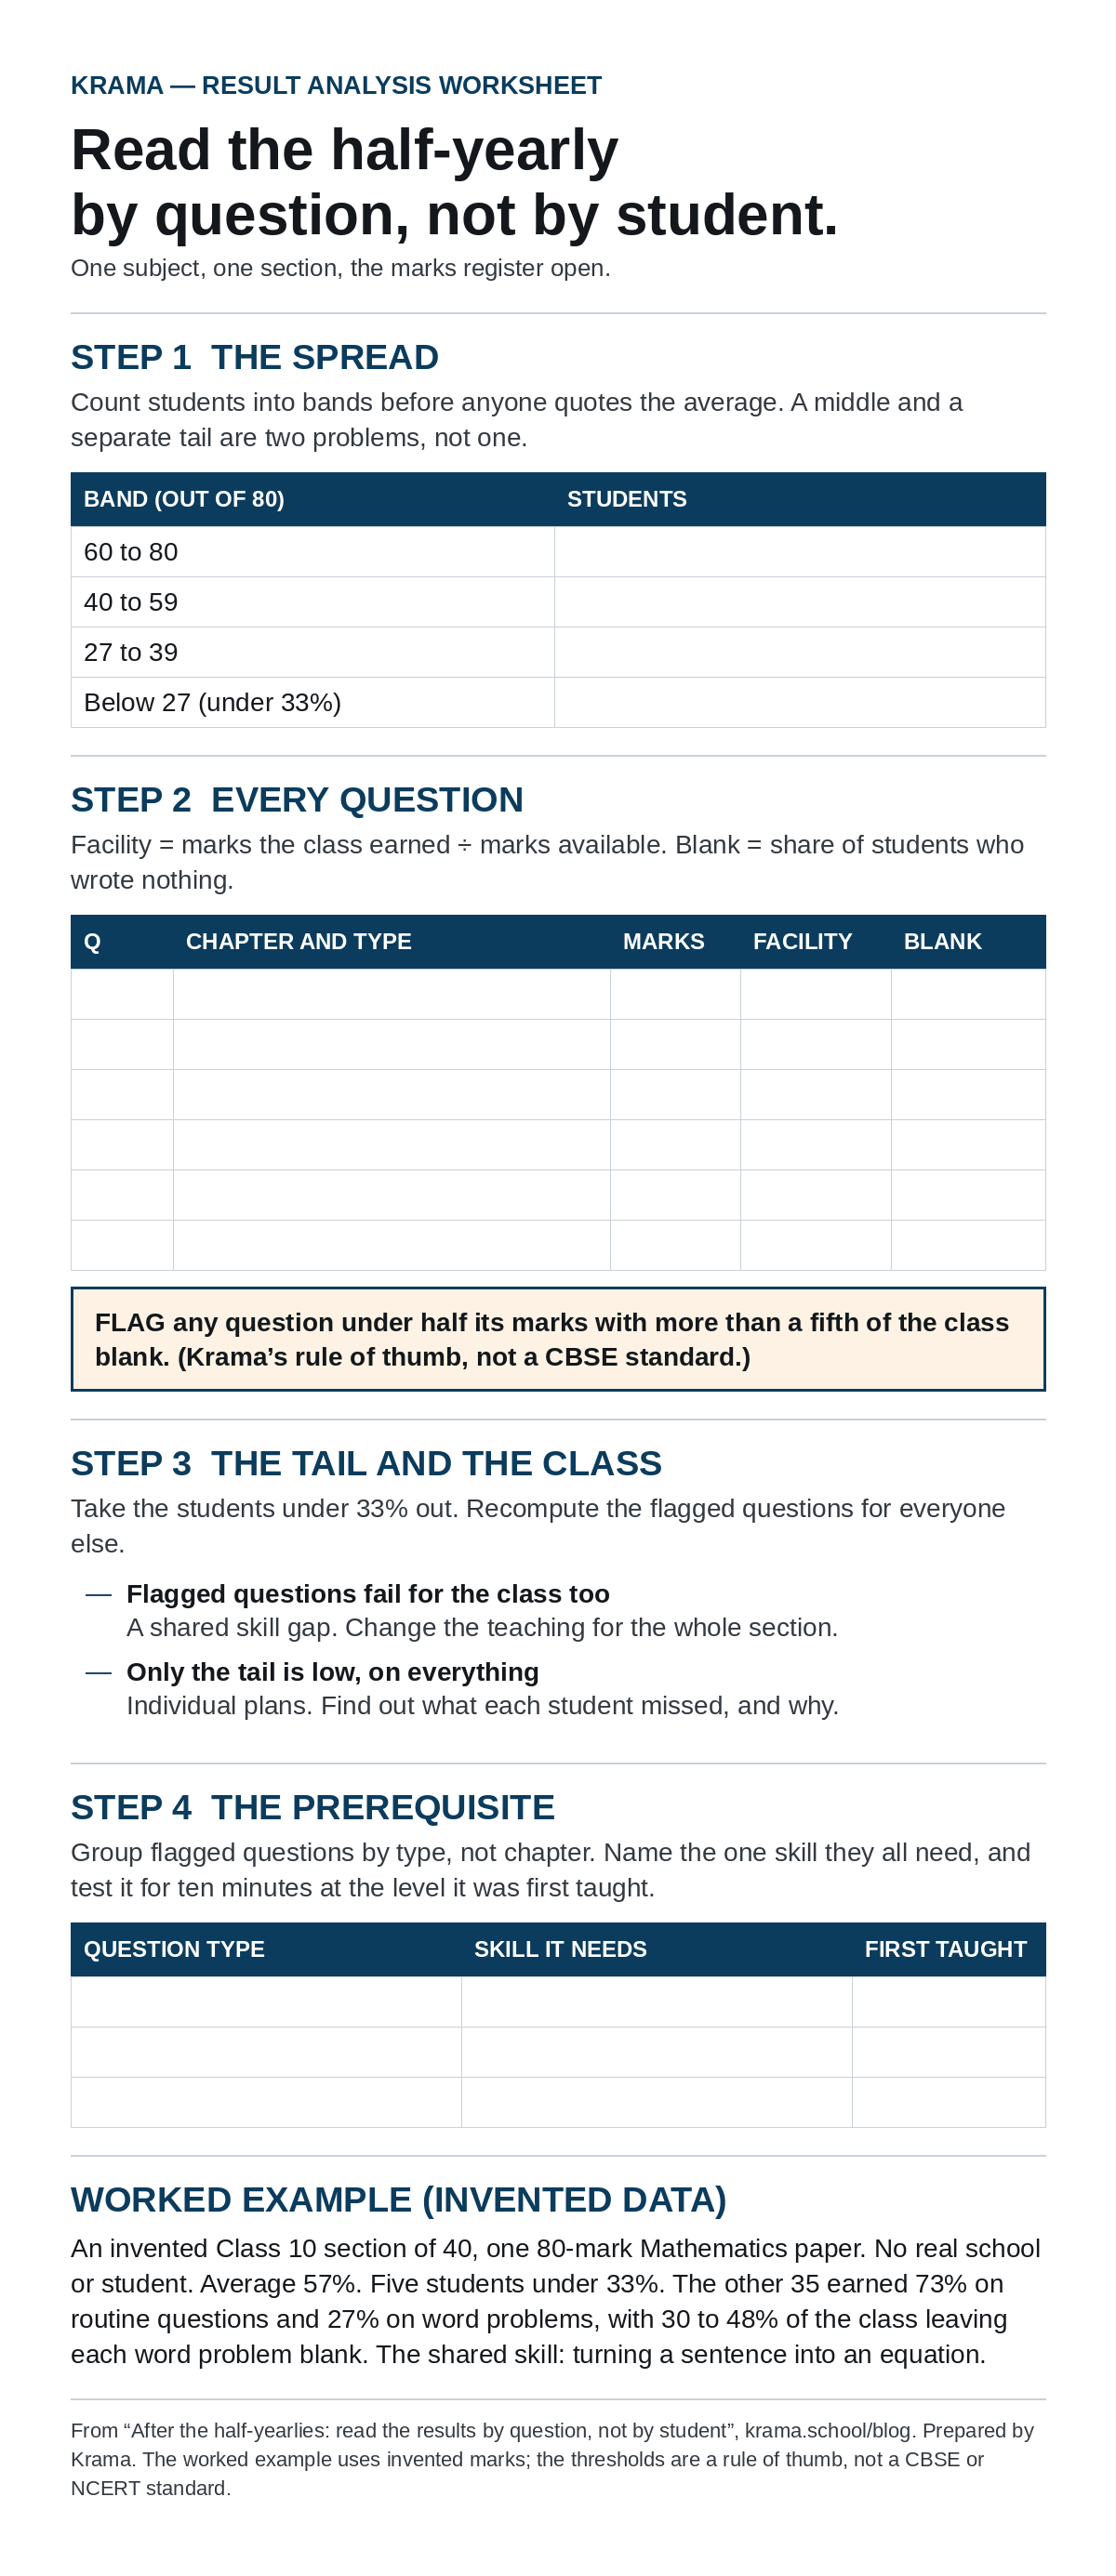
Half-yearly result analysis worksheet
One page for a subject teacher or HOD with a marks register open. Three steps (cohort, question, prerequisite), the columns to fill in, the two flags to look for, and what each finding means for the next month of teaching.
 Download the sheet
Tell me how this went at your school
Replies from principals and coordinators are what shape the next post. If your experience differs from what is written here, I would rather know.